

In a perfect world, log anomalies would speak clearly and never at 2 a.m.
But in reality, log data is massive, alerts can be cryptic, and critical issues often get buried in the noise. That’s why choosing the right log management tool is crucial, it’s the first line of defense against downtime, breaches, and costly oversights.
This blog breaks down some of the top log management tools on the market, what they do well, where they stand out, and how they fit into your stack. And because even the best log tool can’t guarantee the right person gets notified at the right time, we’ll also highlight how OnPage complements these platforms, ensuring anomalies don’t just get detected, but get addressed. Fast.
What is Log Management?
Log management is the process of collecting, storing, analyzing, and monitoring log data generated by various systems, applications, and devices.
These logs contain detailed records of everything that occurs including login attempts, system errors, or configurations, which help teams detect anomalies, failures, and data breaches.
Log management tools centralize this data so it’s searchable, filterable, and easier to act on. They often include features like real-time monitoring, dashboards and long-term retention policies.
TL;DR Log management turns messy system data into something useful for IT, DevOps, and security teams. And, log management tools make parsing through this data a hell of a lot easier.
What are the Different Types of Logs?
There are many types of logs that are used to capture different types of data across various systems, applications, and infrastructure, some of the most common types are:
System Logs track operating system events like device status or kernel errors and are used by system administrators for troubleshooting and auditing.
Application Logs detect events and errors specific to an application (transactions and user actions) so that developers and support teams can debug and improve app performance.
Security Logs monitor authentication attempts, access control, firewall activity, and other security-related events enabling security teams to detect breaches, policy violations, or suspicious activity.
Audit Logs tell compliance and security officers who did what, when, and where, across systems to improve accountability and regulatory requirements.
Event Logs provide detailed information about system and application-level events recorded on operating systems so that IT teams can monitor system health and troubleshoot issues.
Web Server Logs track HTTP requests, IP addresses, URLs visited, and response codes so that DevOps and Marketing teams can analyze traffic, troubleshoot errors, and monitor uptime.
Database Logs observe queries, transactions, changes to data, and errors for database administrators and backend engineers to tune and audit performance.
Network Logs monitor traffic flow, connection attempts, firewall activity, and domain name system (DNS) queries and are used by network engineers and security teams to improve security and maintain network speed.
What is the Log Management Process?
The log management process is the end-to-end workflow of how logs are handled by your log management tools. To break it down from creation to action, these are the steps:
Generation All systems, applications, devices, and networks automatically generate logs as they operate.
Collection Logs are then collected by a log management tool, centralizing all of the logs in one place.
Parsing & Normalizing Considering that all logs come in different formats, it is really hard to read them, so log management tools clean and structure log data so that it can be more easily analyzed.
Storage Depending on retention policies and compliance requirements, logs are stored in these systems either long-term or temporarily.
Analyzing & Monitoring Then the log management tools scan logs for patterns, errors, and anomalies, enabling teams to ensure that everything is functioning well and no suspicious activity has been detected.
Alerting & Response However, it would be difficult for teams to continuously monitor their logs to detect these issues. So, the log management tool delivers an alert when something unusual happens. Typically the tools are integrated with an intelligent alert management system that ensures the right responders are immediately aware of the anomaly and can act fast.
Archiving & Deleting Logs are then either archived for compliance and documented or deleted (after a certain retention period).
What are the Essential Features of Log Management Tools?
When investing in a log management tool, here are some of the essential features to look out for:
Centralized Log Collection Gather logs from all of your systems, apps, and devices into one place, no more hunting through scattered files.
Intelligent Parsing & Normalization Automatically clean and structure diverse log formats so you can analyze them easily without manual wrangling.
Scalable Storage & Retention Store massive amounts of log data efficiently, with smart retention policies to meet compliance and cost goals.
Search & Query Capabilities Powerful, fast search tools that let you slice and dice logs by time, source, error codes, or custom fields.
Real-Time Monitoring & Alerting Detects anomalies or critical events instantly and triggers alerts to your incident alerting tools to notify the right engineer before issues escalate.
Dashboards & Visualization Interactive graphs and dashboards that help you spot trends and patterns at a glance.
Integration Support Connect with your existing tools like ticketing systems, chat apps, or incident response platforms.
Security & Compliance Ensure logs are tamper-proof and stored securely to meet regulatory requirements like HIPAA or GDPR.
Role-Based Access Control Controls who sees what, so sensitive logs stay in the right hands.
What are the Top Log Management Tools?
Graylog

Source: Graylog
Graylog is a flexible, open-source log management platform built to handle large volumes of data with speed and efficiency. It lets you collect, store, and analyze logs from across your environment, all in one centralized place. With powerful search, custom dashboards, and broad integration support, Graylog makes it easy to investigate issues and uncover insights.
Graylog Features
- Real-time log data visibility
- Searchable data for better anomaly detection
- Collect high volumes of log data
Graylog Cons
- Users on Reddit have expressed frustration when upgrading Graylog, breaking their UI or functions.
Graylog Pricing

Source: Graylog
While Graylog has a free open-source solution, they also have higher, paid tiers that come with more features. These include Graylog Enterprise at $15,000/yr, Graylog Security and Graylog API Security both at $18,000/yr.
Elastic (ELK Stack)

Source: Elastic
Elastic is a powerful open-source suite for log management, made up of Elasticsearch, Logstash, and Kibana. It’s built for speed, search, and scalability – collecting logs, processing them and visualizing everything in real time. With customization options and a strong developer community, Elastic gives you control over how you manage and explore your data.
Elastic Features
- Quickly search structured and unstructured log data
- Easily scaleable
- Anomaly detection and pattern recognition
Elastic Cons
- Steep learning curve
Elastic Pricing

Source: Elastic
Elastic’s pricing ranges from $99 to $184 per month, however there are some other packages that require your team to contact their sales to gain an understanding of the pricing.
Loki Grafana

Source: Grafana
Loki Grafana is a log aggregation system built for speed, simplicity, and cost efficiency. Unlike traditional log management tools, Loki doesn’t index the log content, it groups and queries logs using labels instead. This makes it lightweight, highly scalable, and works alongside Grafana dashboards for unified observability.
Loki Grafana Features
- Supports integrations with commonly used solutions
- Easy deployment
- Enhanced flexibility by formatting logs during search
Loki Grafana Cons
- Slow parsing during more complex queries
Loki Grafana Pricing

Source: Grafana
While the core open-source Loki software is free of cost, they offer multiple tiers of Grafana Cloud including Pro, Advanced, and Enterprise. Pro is $19/month, Advanced is $299/month, and the Enterprise package requires teams to contact Grafrana for pricing.
Datadog
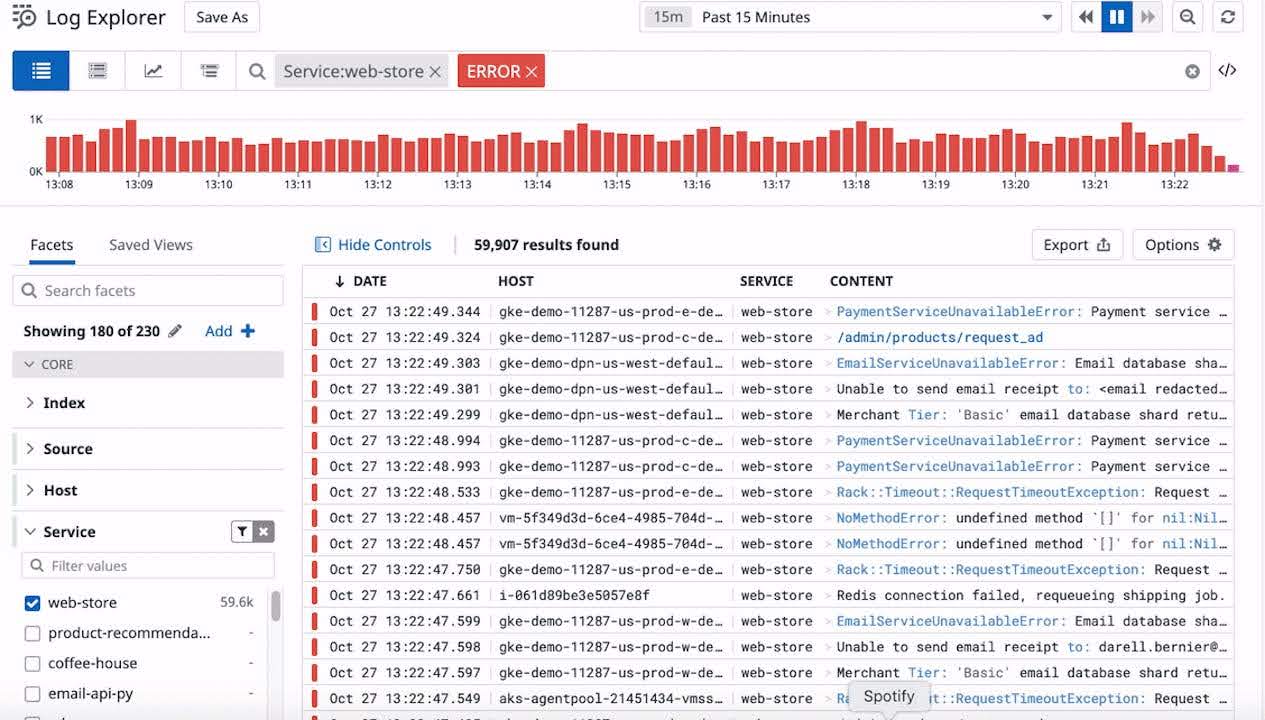
Source: Datadog
Datadog’s log management solution collects, processes, and stores logs from various sources across your infrastructure and applications. It enables centralized log aggregation, making it easier to search, filter, and analyze large volumes of log data in real time. Datadog supports structured and unstructured logs, automatic parsing, and customizable retention policies, helping teams quickly identify issues and understand system behavior.
Datadog Features
- Centralized log collection and processing
- Out-of-the-box pipelines for 200+ technologies
- Log Patterns to surface trends automatically
Datadog Cons
- Datadog is one of the more expensive log management tools
Datadog Pricing

Source: Datadog
Datadog charges $0.10/GB ingested per month and $1.70/million log events indexed/month, so you pay based on exactly how much data you send and store for search.
SolarWinds

Source: SolarWinds
SolarWinds offers log management as part of its broader IT operations suite, helping teams collect, search, and analyze logs from across systems. The platform supports centralized log aggregation, real-time event correlation, and long-term storage. It’s designed to assist in troubleshooting, performance monitoring, and compliance by making it easier to detect anomalies and patterns in log data.
SolarWinds Features
- Event Log tagging and categorization
- Real-time log monitoring
- Effective searching and filtering
SolarWinds Cons
- In 2020, SolarWinds had a major cybersecurity breach, which still leads potential buyers to be wary today
SolarWinds Pricing

Source: SolarWinds
SolarWinds log management is a part of SolarWinds Observability Self-Hosted and the product starts at $6/node per month.
New Relic

Source: New Relic
New Relic offers built-in log management that lets teams ingest, search, and correlate logs with metrics and traces in one place. It supports both structured and unstructured logs and integrates with common logging tools.
New Relic Features
- Scalable log analysis
- Custom dashboards
- Machine learning insights through Applied Intelligence
New Relic Cons
- Non-transparent pricing that can add up quickly
New Relic Pricing

Source: New Relic
While we are unable to view the actual cost of New Relic, they have 3 pricing options including Standard, Pro, and Enterprise, along with the Free version of their software.
Dynatrace

Source: Dynatrace
Dynatrace provides automated log collection and contextual analysis, linking logs with metrics and traces across dynamic environments. It supports real-time search, enrichment, and streamlined troubleshooting without manual setup.
Dynatrace Features
- 750+ integrations
- Automatic issue detection
- Transparent pricing
Dynatrace Cons
- Very complex if you are looking for a more simple use case
Dynatrace Pricing

Source: Dynatrace
The pricing for Dynatrace Logs Powered by Grail, starts at $0.20 per GiB ingested, plus $0.0007 per GiB-day retained, and $0.0035 per GiB scanned for queries. Pricing scales based on usage, and to use their log management you need an active subscription to one of their other plans.
Sumo Logic

Source: Sumo Logic
Sumo Logic offers unified, cloud-native log management and analytics, uniting logs, metrics, and events in one platform. With AI-driven pattern detection, anomaly alerts, and pre-built dashboards, it simplifies troubleshooting, security monitoring, and compliance across multi-cloud environments.
Sumo Logic Features
- Centralized log monitoring
- Real-time log management
- Multi-cloud support
Sumo Logic Cons
- Unintuitive UI
Sumo Logic Pricing

Source: Sumo Logic
Sumo Logic has three pricing plans including Essentials, Enterprise Suite, and Flex, for exact quotes, teams must contact sales.
Better Stack

Source: Better Stack
Better Stack offers a modern log management solution, built on top of ClickHouse, designed for performance, clarity, and collaboration. It allows teams to ingest structured logs, write SQL-like queries, and visualize data in real time. Logs are stored in structured format (JSON), making them easy to search and analyze.
Better Stack Features
- Real-time search across up to 1 billion lines/second
- Structured JSON log storage for simple, fast filtering
- Team collaboration capabilities
Better Stack Cons
- There may be a learning curve if users are unfamiliar with SQL
Better Stack Pricing

Source: Better Stack
Better Stack offers usage-based pricing, and has a free tier. Paid plans start at $0.45 per GB ingested, with retention priced separately at $0.025 per GB/week retained.
Logz.io

Source: Logz.io
Logz.io is a cloud-based log management platform built on the ELK stack. It provides real-time log ingestion, AI-powered insights, and a modern UI for streamlined search and analysis.
Logz.io Features
- AI-powered insights
- Automated root cause analysis
- Excellent customer support
Logz.io Cons
- Not as affordable for SMBs
Logz.io Pricing

Source: Logz.io
Logz.io’s Log management is $0.92/GB ingested and changes with the number of days the data is retained. Additionally, they have packages for Infrastructure Monitoring (Starting at $0.40) and Distributed Tracing (Starting at $0.16).
Amazon CloudWatch

Source: Amazon
Amazon CloudWatch is a monitoring and log management service built for AWS, but it can also collect data from non-AWS environments. With the CloudWatch Agent or API, you can send custom logs and metrics from on-prem servers, other cloud platforms, and containers.
Amazon CloudWatch Features
- Collect data from 70+ AWS solutions
- Real-time log monitoring
- AI-driven search
Amazon CloudWatch Cons
- Not as seamless when monitoring systems and applications outside of the AWS environment
Amazon CloudWatch Pricing

Source: Amazon
Amazon CloudWatch offers a free version of CloudWatch that can be used with many services within the AWS ecosystem, however they also have a paid tier that is priced based on usage. Log collection starts at $0.25/GB for infrequent log access and $0.50/GB for standard.
SigNoz

Source: SigNoz
SigNoz is an open-source observability platform built on Open Telemetry and ClickHouse, offering unified logs, metrics, and tracing in a single platform. It ingests structured logs, supports full-text search and live tailing, and enables SQL-like queries on high-volume data for fast root cause analysis.
SigNoz Features
- Comprehensive observability platform
- Customizable Queries
- Highly scalable
SigNoz Cons
- Initial deployment has been noted to be more complex than other solutions
SigNoz Pricing

Source: SigNoz
SigNoz offers a free open-source solution along with two paid tiers including Teams which starts at $49/month and Enterprise which starts at $4000/month.
Syslog-ng

Source: Syslog-ng
Syslog-ng is an open-source log collector and forwarder that centralizes log data from across your infrastructure. It supports a wide range of input sources and output destinations, allowing organizations to collect logs from various servers, network devices, and applications, then route them in files, SIEMs, or log analysis tools.
Syslog-ng Features
- Secure log storage for compliance
- Integrates with popular data platforms
- Centralized log management and routing
Syslog-ng Cons
- Limited UI
Syslog-ng Pricing

Source: TrustRadius
Syslog-ng has a free open-source version and a paid version. There was no pricing listed on the website itself, however, TrustRadius lists that their paid version is $2,800/month.
OpenObserve

Source: OpenObserve
OpenObserve is an open-source log management platform designed for fast ingestion and real-time querying of large volumes of logs. It offers scalable storage, flexible search, and visualization tools to help teams quickly analyze and troubleshoot data from multiple sources in one place.
OpenObserve Features
- Speedy performance
- Great scalability
- Storage costs are lower than its competitors
OpenObserve Cons
- Unintuitive installation process
OpenObserve Pricing

Source: OpenObserve
OpenObserve has multiple tiers for both Cloud and Self-Hosted options. The options for Cloud range from their Free version, Standard Cloud which is paid with usage, starting at $0.30/GB, and an Enterprise solution that requires you to consult with sales for a quote. The self-hosted has only a Free version and Enterprise solution for teams using 200+/GB ingested per day.
Parseable

Source: Parseable
Parseable offers a log management solution designed to collect, organize, and analyze log data from multiple sources. It helps teams centralize their logs for easier searching and troubleshooting, enabling faster identification issues. With flexible data ingestion and real-time querying, Parseable supports efficient log analysis to improve system visibility and operational insights.
Parseable Features
- Fast query performance
- 100+ integrations
- Basic user friendly dashboards
Parseable Cons
- For more complex visualization, integrations are required
Parseable Pricing

Source: Parseable
Parseable doesn’t list their pricing, however they have an estimate generator shown above that teams can submit how they will use the product for a quote.
VictoriaLogs

Source: VictoriaLogs
VictoriaLogs is a fast, open-source log database built for cloud-native environments. It uses efficient storage to support full-text search at scale and works seamlessly with other popular platforms.
VictoriaLogs Features
- Easy-to-implement
- Powerful integrations
- Easy querying
VictoriaLogs Cons
- Still a fairly new product, so doesn’t have the same credibility as some of the other solutions
VictoriaLogs Pricing

Source: VictoriaLogs
VictoriaLogs offers a free open-source version of their platform as well as three packages ranging from Silver, Gold, and Platform. To get information on pricing you must request a quote.
Which Log Management Tool is the Best for me?
Look, I wish that I could answer this with a magic tool that would fulfill all of your logging needs. But unfortunately that isn’t going to happen. So, it is incredibly important that you evaluate all of your business needs to understand the type of solution you need. Some things you may want to consider are your team’s budget, storage needs, developer resources, and how complex your current infrastructure needs are. But, I do know that one thing is for certain, teams need a reliable way to alert their team of critical issues detected by their log monitoring tools. Because while these tools are incredibly helpful in collecting and analyzing logs, that last mile that needs to be completed when they do find an error is where things can go wrong.
What’s the Best Way to Get Alerts from Log Monitoring Tools?
Not all logs are created equally…and that’s the problem. Even with advanced monitoring, it’s tough to spot which log events actually need immediate attention. High volumes, false positives, and subtle anomalies can bury real issues. Incident alerting tools like OnPage cut through the noise by automatically identifying and escalating critical events caught by your log management tools. Some of the key features OnPage provides for log monitoring is:
High-priority alerting
OnPage not only delivers alerts that mobilize your team to critical incidents, it also can send differentiated alerts based on severity. Alert fatigue is a massive problem when it comes to logs, because any small anomaly may be caught by your log management solution, bombarding your team with thousands of alerts. With OnPage teams can set alert thresholds ensuring that only high-priority alerts cut through the clutter, sending teams into action and lower priority events are sent less intrusively to eliminate alert noise.
Alert routing and escalations
When an incident occurs teams must act fast to ensure that their systems and applications maintain uptime. But what happens when the alert has nowhere to go or worse it goes to the right person and they don’t see it. We don’t want to know. OnPage’s fail-safe digital alerting makes sure that there is always someone there to answer the alert. With digital schedules OnPage can not only route messages to the right person, but the right role. Maybe there were too many failed authorization attempts, OnPage will ensure that the on-call security analyst is immediately aware. And what if they don’t answer? Then OnPage routes the alert based on your preconfigured escalation policies to the next person in line so that there is always someone managing incidents when they occur.
Seamless Integrations
With OnPage’s Public API integrate with practically any solution in your tech stack. Meaning, of course, that no matter which of these log management tools is right for you, OnPage has your back and will always alert you when they detect anomalies in one of your systems or applications.
Conclusion
Choosing the right log management solution depends on your team’s size, infrastructure, budget, and technical requirements. From open-source platforms like Loki and VictoriaLogs to enterprise-grade tools like Datadog and Dynatrace, each option offers unique trade-offs in performance, flexibility, and cost. Understanding these differences can help streamline troubleshooting, improve system visibility, and ensure critical issues don’t go unnoticed. No matter the stack, pairing log data with an incident alerting system like OnPage can further ensure the right people respond at the right time.
About The Author


