Best Network Monitoring Tools of 2026

Keeping tabs on your network has never been more important. Whether you’re running a small business or managing infrastructure across cloud environments, visibility into what’s happening behind the scenes is essential. But visibility alone isn’t enough…when something breaks, the IT engineer needs to know immediately, so they can take action and resolve critical issues. That’s why a solid network monitoring tool isn’t just about dashboards and graphs, but connecting performance data to real action. In 2026, the best tools not only track your systems in real time but also integrate with alerting platforms that make sure the right people respond.
This blog breaks down the top network monitoring tools on the market and highlights how teams are using them alongside smart alerting solutions like OnPage to close the loop between detection and response.
What is Network Monitoring?
Network monitoring is the process of tracking the health, performance, and availability of your network. It lets you see what’s working, what’s slowing down, and what might be about to break.
At its core, it tracks things like bandwidth usage, latency, uptime, packet loss, and device status. If a router goes offline, a server starts lagging, or a sudden spike in traffic appears, monitoring tools catch it.
But it’s not about spotting issues. Good network monitoring tools give you the data to prevent problems before they impact users. It helps you plan capacity, identify bottlenecks, and troubleshoot faster.
And in most environments, it’s not just one network, it’s cloud, hybrid, remote devices, VPNs, APIs, and everything in between. That’s why monitoring tools are built to pull data from everywhere and let you know when something falls out of line.
What Makes a Good Network Monitoring Tool?
Not all monitoring tools are created equal. The best ones give you real-time visibility…without making you dig for answers. They help you find issues fast and give you the right context to fix them. Here’s what to look for:
Real-Time Data
The tool should provide continuous monitoring using protocols like Simple Network Management Protocol (SNMP), NetFlow, sFlow, or API polling. It needs to detect network events as they happen, not minutes later. This allows teams to troubleshoot issues in real time and avoid delays caused by stale metrics.
Customizable Dashboards
Operators and engineers need to see different things. The ability to build personalized dashboards that surface the most relevant data helps teams focus on what matters to them. A good UI lets you drill down quickly without digging through menus.
Scalability Across Environments
Whether you are monitoring five branch offices or a global hybrid environment, the platform should scale without loss of performance. This means support for distributed data collectors, cloud-native services, containerized environments, and multi-tenant setups is crucial.
Smart Alerting and Noise Reduction
Threshold-based alerts are only useful when they’re accurate. Good tools support dynamic thresholds, suppression rules, and conditional alerting logic. Even better if high-priority alerts can trigger integrations with incident response platforms like OnPage, which can escalate unresolved issues based on schedules and escalation chains.
Built-in Integrations
Monitoring doesn’t happen in isolation. Tools should integrate cleanly with IT service management platforms like Jira or ServiceNow, log aggregation tools like Splunk, and incident response platforms through webhooks or APIs. This keeps alerting, ticketing, and response workflows in sync.
Anomaly Detection and Forecasting
Instead of relying on static thresholds, many tools now use machine learning or statistical models to identify unusual patterns. This can catch issues that might not trigger traditional alerts, such as gradual latency increases or traffic spikes outside of normal usage windows.
The Best Network Monitoring Tools of 2026
There’s no one-size-fits-all tool. Here are the top picks in 2026 and how they stack up:
PRTG Network Monitor
PRTG Network Monitor is an all-in-one network monitoring solution that uses a sensor-based approach to track performance across devices, applications, and infrastructure. It’s known for its user-friendly interface, flexible deployment options, and strong out-of-the-box support for common protocols like SNMP, Windows Management Instrumentation (WMI), and NetFlow.
Best for: Small to mid-sized environments
PRTG Network Monitor Features
- Mobile and web access to dashboards
- Customizable dashboards and maps
- Monitoring for distributed networks
PRTG Network Monitor Pricing

Source: Paessler
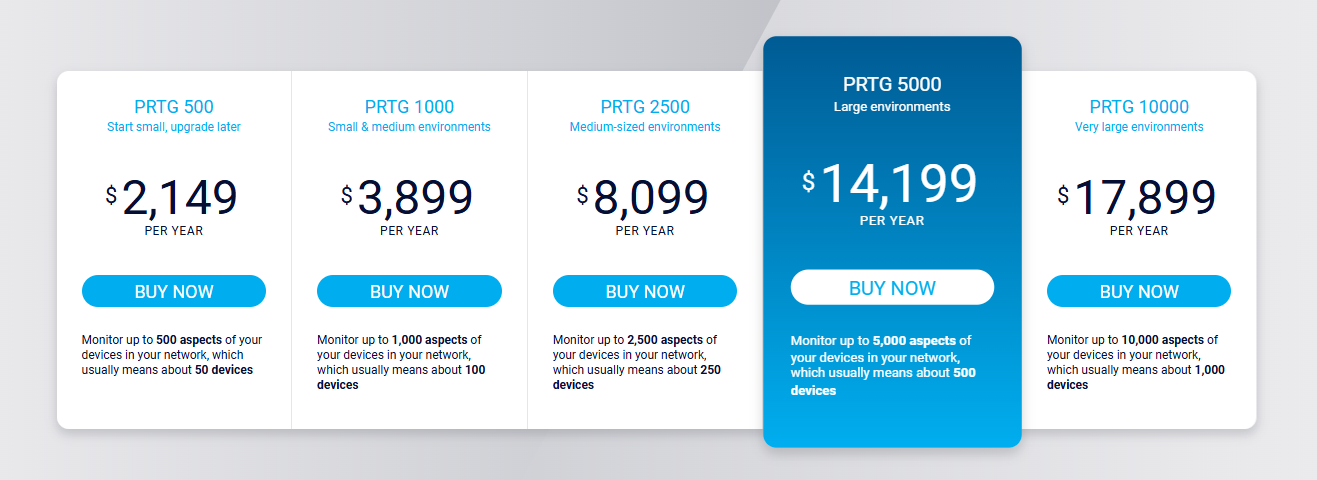
There are five pricing plans for PRTG Network Monitoring including PRTG 500 for $2,149/year, PRTG 1000 for $3,899/year, PRTG 2500 for $8,099/year, PRTG 5000 for $14,199/year, and PRTG 10000 for $17,899/year.
SolarWinds Network Performance Monitor
SolarWinds Network Performance Monitor is an enterprise-grade tool designed to monitor the availability and performance of network infrastructure. It offers visibility into routers, switches, firewalls, and other devices using SNMP, NetFlow, and more.
Best for: Large or complex network environments
SolarWinds Network Performance Monitor Features
- Continuously tracks network availability across hybrid environments
- Easily visualize traffic flow, identify bottlenecks, and trace issues to the root cause through intelligent path and network monitoring
- Correlate and analyze real-time and historical performance data across multiple network layers
SolarWinds Network Performance Monitor Pricing

Source: SolarWinds
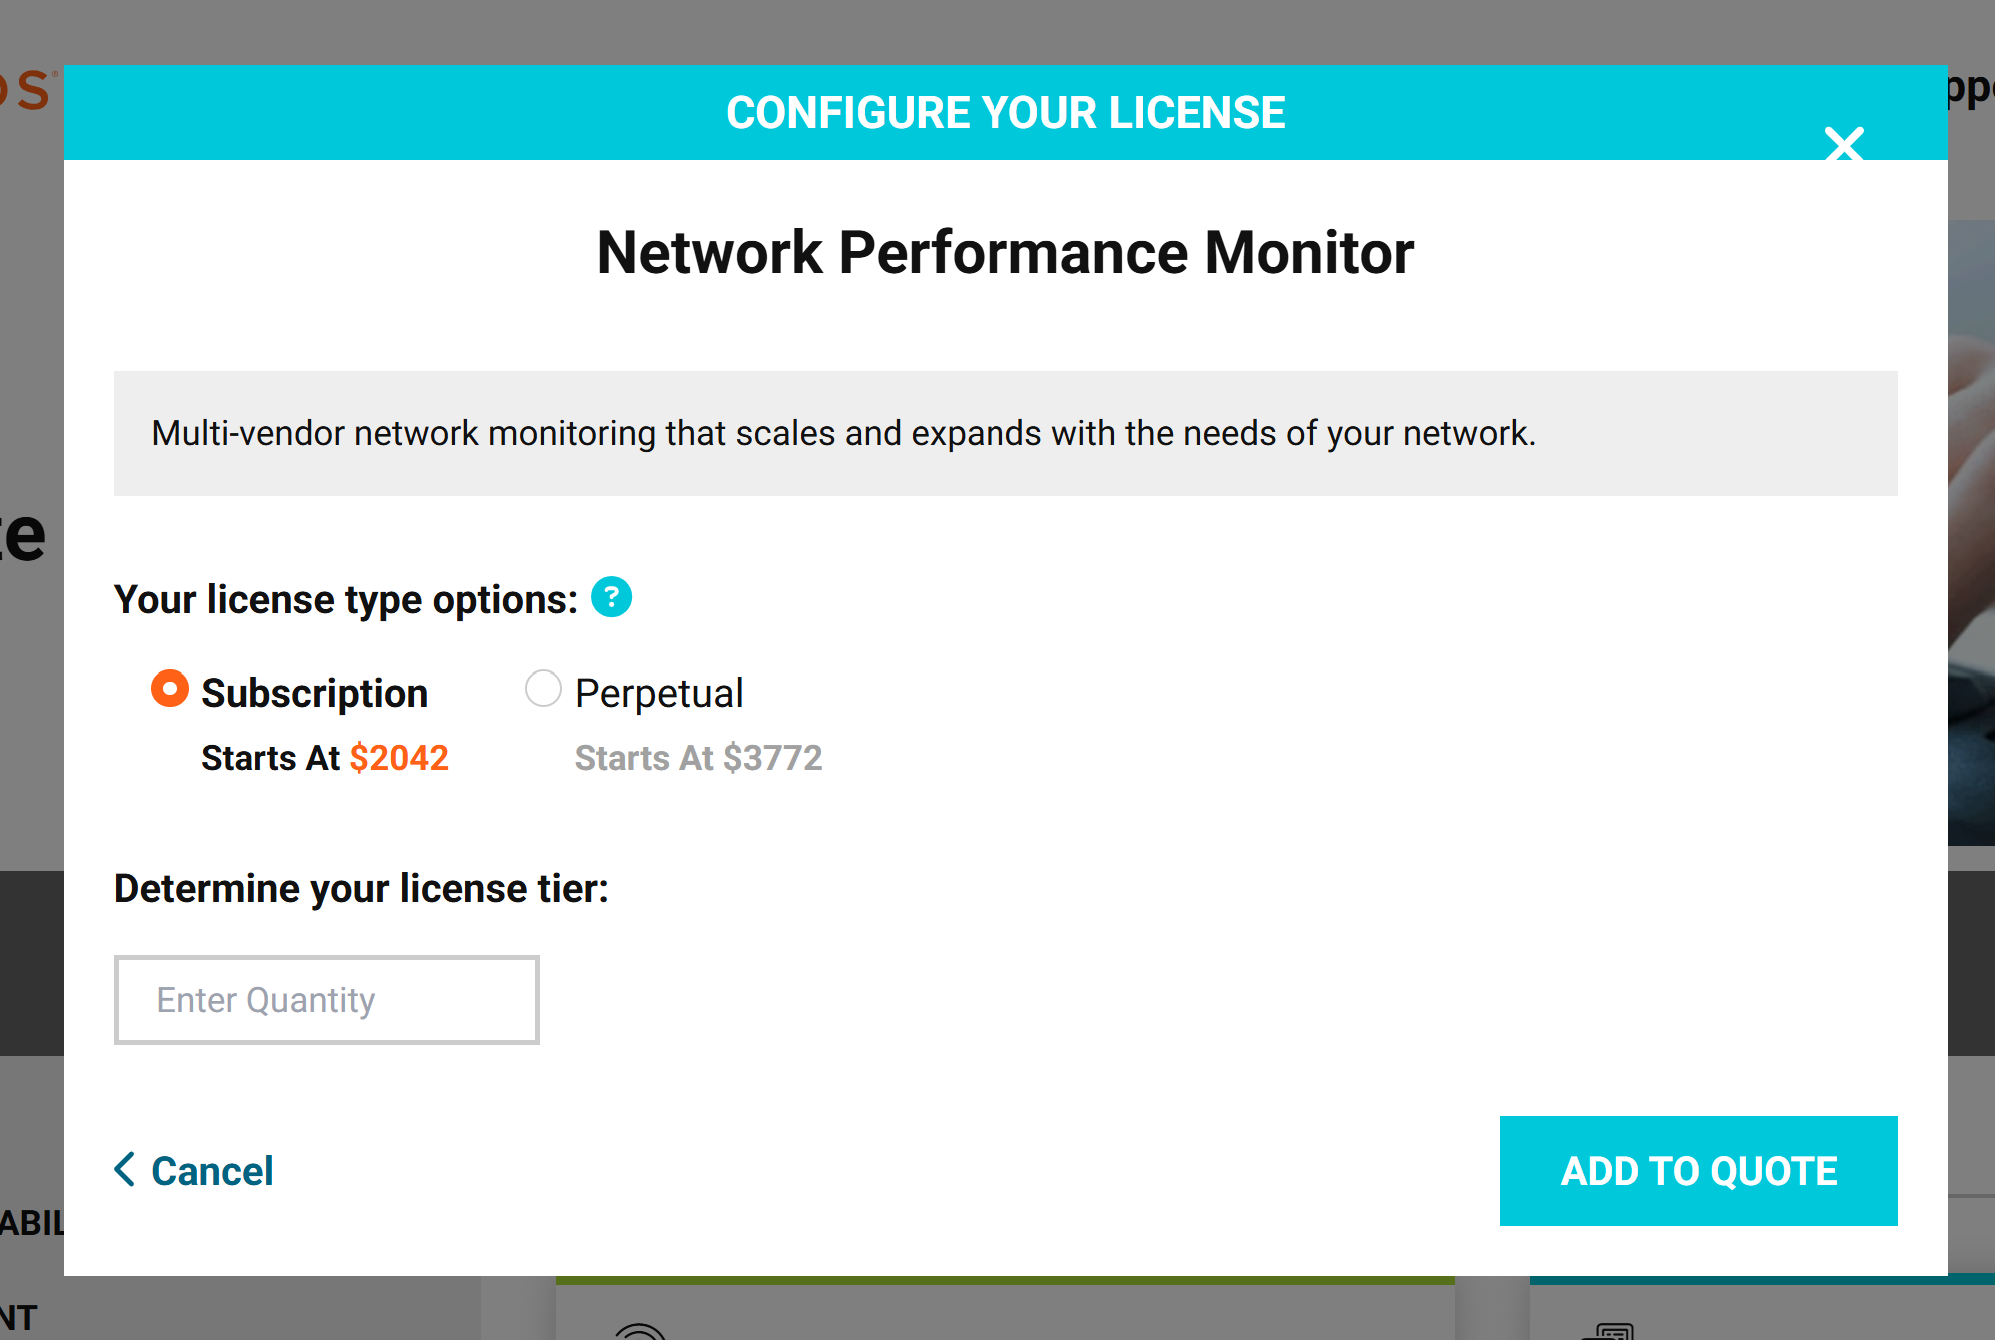
SolarWinds offers two licensing options for Network Performance Monitor including a subscription plan starting at $2042 and perpetual plan starting at $3772. For a more accurate quote, based on your organization’s needs and users, teams should contact SolarWinds.
LibreNMS
LibreNMS is an open-source network monitoring system that supports a wide range of devices through SNMP and auto-discovery. It offers real-time performance tracking, customizable dashboards, and strong support for API integrations.
Best for: Teams that need flexibility and are budget-conscious
LibreNMS Features
- Strong alerting via integrations
- Optimized for web and mobile use
- Active user community
LibreNMS Pricing
LibreNMS is a free, open-source solution for users.
Auvik
Auvik’s network monitoring focuses on real-time visibility, automated discovery, and performance tracking across all connected devices. It continuously monitors network health using SNMP and flow protocols, displays traffic patterns, and highlights issues like high latency, packet loss, or device downtime.
Best for: Small to mid-sized IT and MSP teams
Auvik Features
- Interactive maps that enable visualization of connections and investigation of issues
- Real-time performance monitoring and detailed insights
- Device dashboards and troubleshooting tools available at the click of a button
Auvik Pricing

Source: Auvik
There is no pricing listed for Auvik, however they have a form (shown above) that teams can fill out to receive a pricing estimate.
Icinga
Icinga is an open-source network monitoring tool designed for flexibility and extensibility. It tracks the availability and performance of network devices, services, and infrastructure components using SNMP, plugins, and custom checks. Icinga offers real-time monitoring, alerting, and detailed visualization through customizable dashboards.
Best for: Teams requiring full control over their monitoring stack and are comfortable with configuration and setup
Icinga Features
- Monitor multiple devices at one time
- Real-time monitoring
- Time-series metrics for capacity planning
Icinga Pricing

Source: Icinga
Icinga requires teams to contact sales to get an accurate rate for their subscription.
AKiPS
AKiPS is a high-performance network monitoring and management tool designed for large-scale environments. It specializes in ultra-fast SNMP-based polling, capable of monitoring hundreds of thousands of interfaces and devices with minimal hardware. AKiPS auto-discovers devices, tracks availability and performance, and offers detailed historical data for trend analysis. With syslog integration and a lightweight web interface.
Best for: IT teams that need speed, scale, and reliability without a complex setup.
AKiPS Features
- High-Speed, Large-Scale Monitoring
- Proactive Alerting and Dashboards
- Fast Deployment and Long-Term Data Retention
AKiPS Pricing

Source: AKiPS
AKiPS doesn’t list their pricing on the website, but has a form users can fill out to get a personalized quote. However, users on Reddit have reported a payment of $15k per year with 35 pages and 1,000 switches/routers.
Why Network Monitoring Tools Aren’t Enough
Just because your monitoring tool caught something doesn’t mean the right person saw it or responded in time. Here are some of the challenges teams face when relying on monitoring tools alone for alerting:
Missed Alerts
If alerts only show up in dashboards or get buried in email inboxes, they’re easy to miss. Monitoring data isn’t helpful if it sits in silence.
Alert Fatigue
When teams get pinged constantly, they start tuning out notifications, especially if most of them are irrelevant noise. Unfortunately, critical issues get lost and teams get frustrated.
No Clear On-Call Ownership
If no one knows who’s responsible for a given alert, it can go unacknowledged and waste time bouncing the issue between teams.
No Real-Time Escalations
If someone doesn’t respond to an alert…then what? Without an escalation path, you’re relying on luck.
Monitoring ≠ Incident Response
Monitoring tells you what’s wrong. It doesn’t guarantee anyone acts on it. You need a separate system to drive response.
How to Pair Monitoring Tools With a Smart Alerting Platform
The best monitoring setup still falls short if it doesn’t connect people to problems. That’s what alerting systems are for!
Monitoring tools are built to collect and analyze data. They’re great at telling you what’s happening across your environment. But they’re not designed to notify the right person at the right time in a way that drives action.
Alerting platforms act as a communication layer between your monitoring stack and your response team. They make sure alerts are:
- Routed to the right person based on schedules and ownership
- Escalated automatically if no one responds
- Tracked with full acknowledgement and audit logs
If you want real incident response, you must stop relying on your monitoring tools’ native alerting and pair it with a purpose-built alerting platform.
OnPage fits that need. It integrates with all of the solutions above, manages on-call schedules, handles escalations, and gives you visibility into who responded and when. This is what closes the loop and enhances the benefits of your monitoring solution.
Conclusion
Network monitoring is essential, but it’s only one step. If no one hears about an alert, the problem doesn’t get fixed. Choose a network monitoring platform that fits your infrastructure. But also make sure your alerting platform can turn that data into action.
Monitoring without alert management is like a fire alarm that doesn’t make a sound. Network monitoring makes sure issues are identified, OnPage makes sure they are heard.


